Step 1: Open Developer Tools
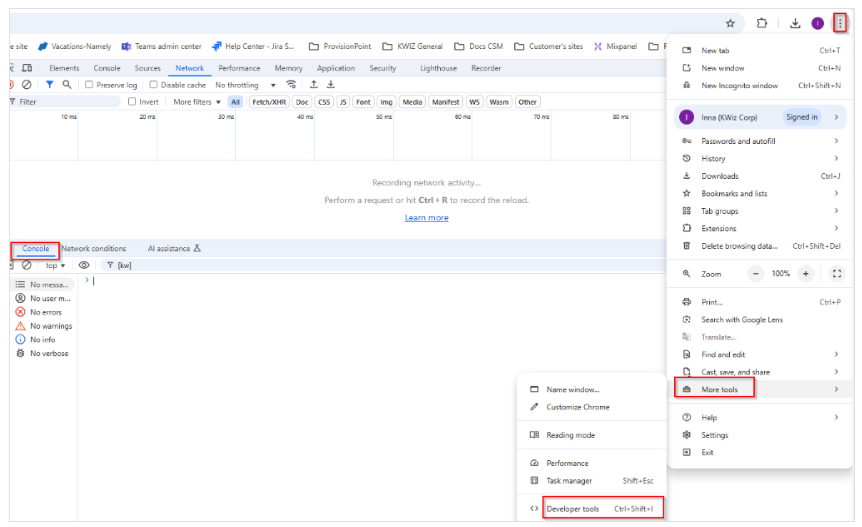
- Open the form where the issue occurs.
- Press F12 (or Ctrl + Shift + I) to open the browser’s Developer Tools.
- Navigate to the Console tab to view the JavaScript and debug messages.
Step 2: Enable Debug Mode
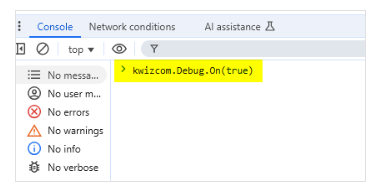
- In the Console tab, type the following command to enable KWizCom debug mode kwizcom.Debug.On
- Press Enter to activate the debug mode, then refresh the page to ensure debug messages are captured.
Step 3: Filter Console Logs for KWIZ Messages
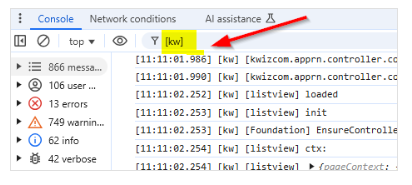
- In the Console tab, locate the filter field (usually at the top).
- Type [kw] into the filter field to show only KWIZ Forms-related messages. In case you want to check Data View Plus type [DVP] or [CMS] for CMS feature.
- Reproduce the issue to see if any errors or relevant messages appear in the log
Step 4: Capture Console Logs
- After reproducing the issue, select all messages in the Console and copy the logs
- Open a text editor, paste the logs, and save the file.
Step 5: Open the Network Tab to Capture Failed Requests
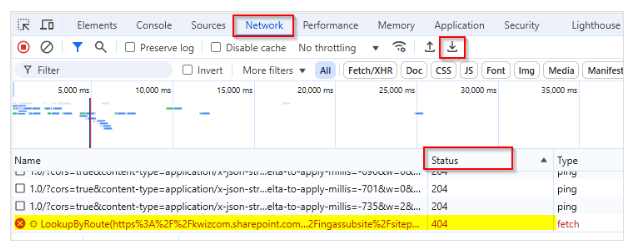
- In the Developer Tools, click the Network tab.
- Reproduce the issue again
- Look for any 404 or 400 errors related to failed network requests. You can filter the requests by Status to quickly find these error messages.
- Click on the error to save the HAR file with a relevant name.
Once you’ve collected both the Console logs and Network logs, send them to support to help further analyze the issue.