Dashboards Overview
Dashboards provide an overview of M365 configuration for workspaces created in and imported into the app. All elements within the Dashboards are interactive and can be selected to show a filtered report with more information on each workspace.
Who can access Dashboards?
Access to the dashboard is only available to users assigned the App Manager or Dashboard User security roles, read the Setup Access to ProvisionPoint article to adjust who can see them.
What is displayed in the Dashboard
There are three sub menus shown within the Dashboard: Content, Privacy and Lifecycle
Content
Expand to read more about the Content sub menu.
The Content Dashboard displays a count of your workspaces by:
- Service Type (e.g. a Microsoft Team, a Site Collection etc.)
- Service Definitions
- Pending Approval
This 'New workspaces requests' chart displays new workspace requests over a period of time, allowing you to see busy request times easily. Zoom in and out to look at specific dates or periods of time.
Privacy
Expand to read more about the Privacy sub menu.
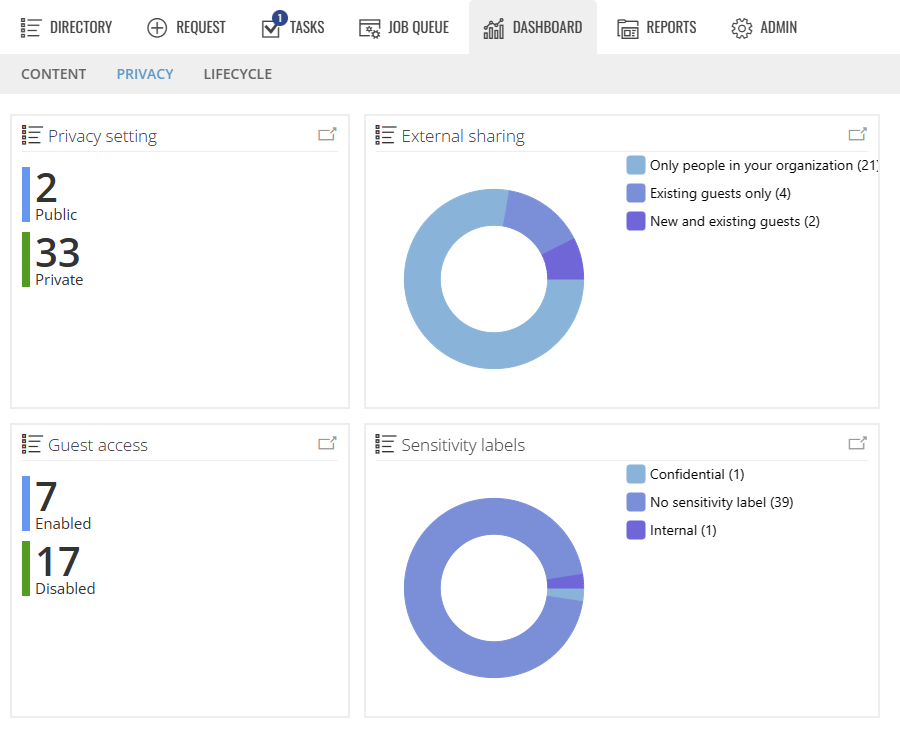
The Privacy Dashboard focuses more on sharing and access to the workspaces and displays a count of:
- Privacy Settings (Public vs. Private)
- Guest Access (Enabled vs. Disabled).
- External Sharing permissions
- Sensitivity labels (if applied).
Lifecycle
Expand to read more about the Lifecycle sub menu.
The Lifecycle Dashboard displays the
- Status of workspaces, how many are complete, failed, processing, with approval rejected or pending approval
- Lifecycle Policy applied (if Lifecycle Policies are being used).
The Expiry chart shows any workspaces with an expiry date set, allowing you to see any that are due to expire.